According to The California Constitution, Measure K beats Measure J.


  • Measure K has been approved by more than two-thirds (66.83%) of San Bernardino County voters.
  • Measure J has only received 50.70% approval. 
  • Many county voters are wondering what happens if both of the two competing measures pass. Article II Section 10 of the California Constitution states, 

If provisions of two or more measures approved at the same election conflict, the provisions of the measure receiving the highest number of affirmative votes shall prevail.”


  • Because Measure K has received significantly more votes than Measure J, and the two measures conflict, Measure K will be implemented while Measure J will not. 
  • In previous rulings, the Supreme Court of California stated,

“If the measures propose alternative regulatory schemes, a fundamental conflict exists. In those circumstances, section 10(b) does not require or permit either the court or the agency charged with the responsibility of implementing the measure or measures to enforce any of the provisions of the measure which received the lesser affirmative vote. (Taxpayers to Limit Campaign Spending v. Fair Pol. Practices Com (1990) 51 Cal.3d 744, 770-771.)


  • The current San Bernardino County Charter will be updated to include the new pay and term limit clauses voters approved with Measure K. The proposed new county charter, Measure J, should not take effect in accordance with the Constitution.

Background

  • The story behind Measure K and Measure J is a hackneyed example of tactics used by the county ruling elite. Why should voters care? Simply to prevent deceptive tactics from being used by politicians in the future! 
  • Measure J was touted as an effort to replace an “outdated” charter containing sexist gender pronouns and dated workplace governance procedures. Rather, Measure J was placed on the ballot as a panicked response to Measure K by supervisors desperate to protect their own compensation and terms of service. County attorneys were more than happy to oblige in this effort and were careful to include a number of clauses that, while appearing innocuous, place greater power in the hands of senior county bureaucrats.
  • A similar situation took place in 2012 with two competing ballot measures – Measure Q and Measure R. Both measures were approved by more than 60% of voters. 
  • Measure R proposed a reduction in pay, term limits, and staff sizes for elected supervisors. Supervisors placed a competing measure, Measure Q, on the same ballot in response to Measure R. Measure Q received three percent more votes than Measure R. The result was Measure R was never implemented despite being approved by 64% of the San Bernardino County electorate. The cuts in county staff size and budget that voters approved with Measure R were never implemented. 
  • Just as in 2012, Measures J and K conflict with one another. Correspondingly, the provisions of the measure receiving the highest number of affirmative votes – Measure K –  shall control. 
  • Measure K calls for an end of the concept of the “career politician.” Many legislators become addicted to the lucrative pay and pension benefits that come with elected office. The result is that the people’s representatives are at the whim of political party dynamics, special interest groups, corporations, and private individuals with private interests.

Gambling with Taxpayer Dollars

Local Governments are Gambling with your Taxpayer Dollars


Have you ever heard of a Pension Obligation Bond (POB)?


No? – Typically, POBs are a last-resort option for state and local governments. Ringing a bell? – Maybe because POBs were one of the factors that drove the City of San Bernardino into bankruptcy back in 2012.


What  is a POB? They are taxable bonds issued by local government to alleviate the unfunded portion of pension debt. Essentially, they are substituting one debt for another. The proceeds from these bonds are paid directly to the pension funds that are serving the issuer’s employees. Meaning you, the taxpayer, will never see a dime. But you, the taxpayer, assume all the risk!


How does a POB affect me? As a county resident, prepare to be paying for the foreseeable future. POBs are generally designed to extend the principal payments and repayments over a longer period.


The California Debt and Investment Advisory Commission have referred to POBs as a double-edged sword. The Government Finance Officers Association issued an advisory stating “state and local governments should not issue POBs.” So why are County Supervisors using them? Poor budgeting, rising pensions, poor decision-making, and greediness has left them no choice!


Who are POBs for? Primarily local governments looking for a faster and riskier way to pay off debts. CalPERS (California Public Employees Retirement System) is an example. CalPERS funds government employee’s retirements for the City of San Bernardino, Fontana, Adelanto, Grand Terrace, Twentynine Palms, Upland, and the San Bernardino County Housing and Transportation Authorities, to name a few.


In  June of 2020, CalPERS  made the announcement that they will be betting 20% of their $400 billion-dollar on new assets, hoping to receive a return of 7% for the next 10 years. Keep in mind, 7% for the next 10 years is an ambitious goal.


Below is a list of pensions in your area that will be gambled with.

  • San Bernardino Valley Water Conservation District
  • San Bernardino Valley Municipal Water District
  • San Bernardino County Transportation Authority
  • San Bernardino County Housing Authority
  • San Bernardino City Unified School District
  • Rancho Cucamonga Fire Protection District
  • Lake Arrowhead Community Services District
  • Hesperia Unified School District
  • Hesperia Fire Protection District
  • Fontana Unified School District
  • Crestline Lake Arrowhead Water Agency
  • Crestline Village Water District
  • City of Victorville
  • City of Upland
  • City of Twentynine Palms
  • City of Rialto
  • City of Redlands
  • City of Rancho Cucamonga
  • City of Needles
  • City of Loma Linda
  • City of Grand Terrace
  • Big Bear City Community Services District
  • Big Bear Municipal Water District
  • Barstow Cemetery District
  • Apple Valley Fire Protection District
  • Town of Apple Valley
  • Town of Yucca Valley
  • Twentynine Palms Water District


In 2020 and 2019, CalPERS reported returns of an average of 5.7%, and saw its assets decrease by $70 billion in early 2020. In August of 2020, the Chief Investment Officer of CalPERS, the person who set that ambitious goal for the next 10 years, abruptly resigned; leaving America’s largest pool of money in question.


Why are they being issued? Public pension funds that are continually paying out exorbitant amounts of money to retired government workers, are deeply in debt. In 2018, the market pension debt for San Bernardino County was $11 .8 billion making the pension debt of every household in San Bernardino County $80,643 There are several reasons why pension liabilities continue to rise…

  • Investment returns have been extremely volatile
  • Government revenues are down
  • Change in demographics such as longer retirements


Why are POBs so risky? They have a much higher risk of default because they offer a much higher rate of return. Local governments are essentially betting the bonds will provide a higher return that what is owed. That is a big gamble with your money; it will only continue to cost you. If the POB does not earn the high return the government is hoping for, the debt increases. Not only does the government now have a much higher credit and interest rate risk, but the gamble they are making is debt that you, the taxpayer, are obligated to pay.


While current San Bernardino County Supervisors try to look good by offering a solution  of Pension Obligation Bonds, they are simply putting a burden on future generations. Deferring POB payments only increases the overall costs to the government. Jean-Pierre Aubry, the Director of State and Local Research at the Center for Retirement Research at Boston College, expressed a commonly held concern held by academia and industry. “Setting up bond payments…for the first five years as interest only —they are just kicking the can down the road, rather than amortizing the cost in the pension fund…” The debt incurred also represents assets unavailable for other purposes. It could be used for other purposes such as infrastructure, education, and bringing more jobs to the county.


What happens if the gamble does not work? Here are some examples from other counties / cities around our nation:


Stockton, California
In 2007, Stockton, California sold Pension Obligation Bonds worth roughly $125 million to pay off pension liabilities. For it to succeed, CalPERS needed to average a minimum return of 5.81% per year. Starting in 2008, CalPERS lost 25%, leaving the city to file for bankruptcy in 2012 to restructure not only their CalPERS debt, but their new debt caused by the unsuccessful POB gamble.


Detroit, Michigan
In 2005, Detroit, Michigan sold Pension Obligation Bonds worth roughly $1.4 billion to pay off pension liabilities. Suddenly, the pension deficit appeared to be solved without additional furloughs and lay-offs. However, in 2013, the city was obligated to pay their bondholders with cash they did not have, leaving the city to file for bankruptcy shortly after.


San Bernardino, California
In 2012, while bankruptcy allowed San Bernardino City to restructure their debts, the annual operating deficit still exists. Part of the reason, an ever-increasing CalPERS pension debt fueled by lower-than-expected returns. To alleviate their debt, the City of San Bernardino ceded control of their fire department to the county in 2016. As part of this deal, the county imposed an additional property tax on parcel owners within San Bernardino City – without their consent!


San Bernardino City’s pension debt is now San Bernardino County’s pension debt. Shifting the fire services to the county allowed the firefighters to be put on the county’s pension fund. Firefighters pensions were protected at the cost of increased taxes that were not approved by the citizens responsible to pay them.


We want to help San Bernardino County and see real change.


It starts with reducing compensation and term limits for our County Supervisors, and denying the supervisors a charter designed for the supervisors, not for the taxpayer!  Vote  Yes on Measure K. Vote No on Measure J.

The Data

Over the past ten years the San Bernardino County budget increased by 42%. A large part of that increase is directly correlated to staffing expenses. Personnel costs rose by 26% double the rate of inflation.


The county needs elected supervisors with the motivation and moral authority to control personnel costs. Elected officials earning 17 times more the average San Bernardino County household income have a strong incentive to protect their own compensation. Supervisors that earn 231% more than the average county public employee lack the necessary moral authority to insist on reasonable pay structures for local government.


Despite the burgeoning compensation budget, elected supervisors have continued to jettison responsibilities. In 2010, the board off-loaded most of their duties to an unelected Chief Executive Officer. Board meetings are now held twice a month. Is $10,603 per supervisor per meeting really reasonable?


For additional information and data on the leadership problem, see this portion of our website.

What We Are Doing

We believe in big-hearted communities and small government and that people benefit from their elected representatives when both share the same community. We believe compensation of $240,000+ per year is unrealistic. This level of compensation places the representative in a different economic stratus than the citizens they serve. An economic class distinction is created between elected representatives and citizens. Elected officers then serve their class rather than their community.


Our initiative provides elected representatives $60,000 per year for their time and service. This is on par with the $63,857 median household income for San Bernardino County. A single elected representative will still earn the same as an entire household in the county.


We believe one, four year term is sufficient. Serving twelve years, assuming re-election, ensures elected officials’ mindsets are turned. They become part of the bloated bureaucracy rather than driving practical solutions for local citizens.


The Red Brennan Group gathered 75,132 signatures from citizens of the county that agree with us. The initiative is slated for your vote this November.


While successful in qualifying this ballot measure, it is important to stay vigilant. The county has introduced a measure of their own as a way to sidetrack our efforts. Mark Gutglueck from The San Bernardino Sentinel’s wrote County Supervisors Seek Charter Reform In The Face Of Measure To Cut Their Pay.  Below is a short excerpt from the article:

Unwilling to see their pay cut, the supervisors this week struck back, beginning the arrangements to put onto the November ballot what they are representing as a county charter reform measure which would have the practical effect of locking into place a salary and benefit level that is comparable to that which they are already receiving. The diversionary ploy the board of supervisors in conjunction with the top county staff are employing mirrors in multiple respects the same tactic the board utilized in 2012 when tax reform advocate Kiernan “Red” Brennan, for whom the Red Brennan Group is named, qualified what was designated as Measure R for the ballot that year.

The full Sentinel article can be read here. It explains in great detail the history and Red Brennan’s long journey  to successfully qualify the “Supervisor Compensation Reduction and Term Limit Initiative” as a ballot measure. So remember this November vote YES on measure K (Supervisor Compensation Reduction and Term Limits) and NO on measure J (County Charter Reform).

FAQ's Regarding the Supervisor Initiative

HOW ARE RESIDENTS BEING ROBBED?

County Supervisors continue to raise the budget without voter approval. In the last 20 years, the County Budget has increased 178%, while inflation has only increased 48%. This type of growth is not sustainable for our county and continues to increase the budget cost per resident. The budget cost per resident alone has increased by 76%.  In 2018, the average cost per resident was $2,721. From 2008-2020, the annual pension payments to San Bernardino County Employees ballooned from $12.6 million to $38.7 million, an increase of 207%. These outstanding expenditures are not going to be paid for by better budgeting, they are going to be paid for through additional taxes, fees, fines, and licenses like FP-5 that are being placed on county residents. This upcoming election, are you going to vote to continue to get robbed by your county supervisors or set a limit and start to turn this around?

WHY ONE TERM?

Many county supervisors continue to work in the county because their compensation, pensions and benefits only get better over time and far exceed what they would make in the private sector. Are they looking out for county residents or are they focused on how much money they can retire with? Right now, they are trying to make themselves look like the good guy because they are reducing their compensation, but most of them will not take the hit. Our belief in a shorter term is due to these reasons. We are hoping that true San Bernardino County residents that care about our community will run for County Supervisor because they care about improving our home, not their retirement accounts. A lot can be done in one term when you have the right people in office and nothing constructive can get done in three terms when you have the wrong people holding office. This has been proven for years in San Bernardino County. When total compensation is not a priority, the county will have representatives that care about public service and not their own interests. What we have tried is not working and the County is continuing to deteriorate. The people we need are the people that respect the office and are not in it for the prestige or outrageous compensation. It is when you get greedy individuals that you do not see results because they are continuing to prolong initiatives and improvement to another term to continue to increase their salary and deferred compensation.

HOW MUCH HAS BOARD OF SUPERVISOR BUDGET INCREASED OVER THE YEARS?

Every year, the Board of Supervisors has an amount of the budget where spending is up to their discretion. In the past decade alone, the supervisor’s appropriation budget has increased 88%. How are the supervisors spending this money? Our county median household income continues to be less than surrounding counties. Our homelessness rates continue to skyrocket. Our roads are deteriorating. Yet, median earnings for full-time county workers are 45% higher than for full-time private-sector workers.

HOW MUCH HAS THE COUNTY BUDGET INCREASED OVER THE YEARS?

In the past decade alone, the County budget has increased 81%. Putting inflation into the equation, it has increased 115%. While the budget amount continues to skyrocket, county residents should be left wondering where all this money is going. Since 2008, the poverty rate and population rate have equally increased by 6%. Today, 18.2% of the county is in poverty and cities are going bankrupt.

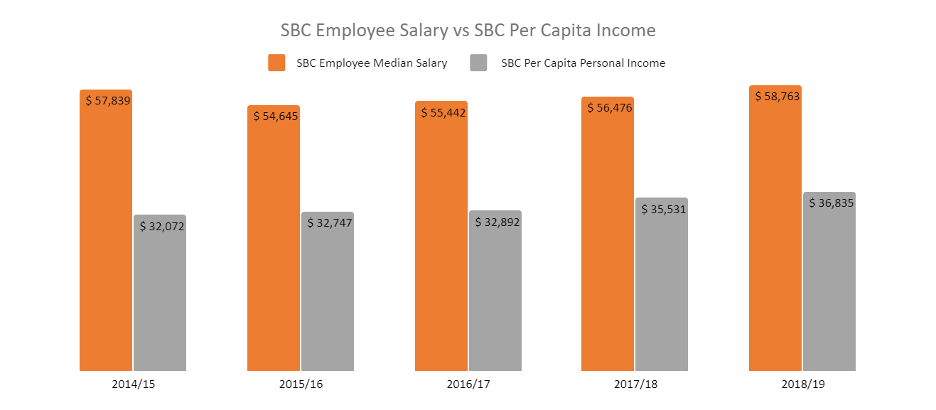
WHAT IS SAN BERNARDINO COUNTY EMPLOYEE SALARY vs. SAN BERNARDINO COUNTY PER CAPITA INCOME?

Although the San Bernardino County Per Capita Personal Income has increased over time, it still in 2018/2019 is 60% lower than the San Bernardino County Employee Median Salary. With all of the money our County Supervisors and staff are making, isn’t it about time we see change in our communities?


SBC Employee Salary vs SBC Per Capita Income

WHAT PERKS DO MY COUNTY SUPERVISORS RECEIVE?

On top of both County-funded 401(k)s and Pension funds, County Supervisors receive both a phone and car allowance. First District Supervisor Robert Lovingood receives $21,900 annually for his car allowance while the other 4 district supervisors receive $14,600 annually. Phone allowances come out to $2,400 a year per supervisor. Moreover, County Supervisors still get paid additionally when they sit on boards such as LAFCO.

HOW MUCH ARE OTHER GOVERNMENT OFFICE OFFICIALS PAID?

Governor Newsom: $210,000 + Benefits

U.S. Senate Leadership: $193,400 + Benefits

U.S. House of Representatives Leadership: $193,400 + Benefits

San Bernardino County CEO Gary McBride: $557,253 + Benefits and according to the charter, he is not authorized to even be holding this position.

I THOUGHT COUNTY SUPERVISORS ONLY MADE $200,933 ACCORDING TO THE COUNTY CHARTER?

“The Board of Supervisors’ “Salary Range” refers to annual compensation, which includes base salary and benefits. Compensation is defined as all salary paid, and the amount of all benefits payable to the Board member or payable on behalf of the Board member, but does not include amounts the County is legally obligated to pay to third parties, including but not limited to employer contributions to a defined benefit retirement system, Medicare, workers compensation, etc.”


Last year alone, Josie Gonzales, Janice Rutherford, Robert Lovingood and Curt Hagman all received over $60,000 of additional income at the county’s expense for their pension.


As you can see from the graphic below, supervisors can receive over $250,000 in compensation annually. However, the point is that despite tricking the citizens into voting for transparency in the 2012 election, there is actually no transparency and the $60,000 voted for by 64% of the citizens in 2012 has been exceeded by more than a million dollars for each of them over the years.

The Board of Supervisors Salary Range
IN WHAT OTHER WAYS IS THE COUNTY BUDGET OUT OF CONTROL?

The Department of Behavioral Health’s budget continues to grow with staffing expenses increasing 69% in the past 5 years while the number of staff only increased 8%. Furthermore, the capital expenditures budget has increased 1497%. Within the department of behavioral health, there are 50+ departments that all have directors, assistant directors, facilities, and overhead being spent on all of that. Is any money going to bettering County resident’s behavioral health or is it going to all the people that work in the department?

HOW DOES THE PROPOSED CHARTER REFORM AFFECT THE CURRENT COUNTY SUPERVISORS?

The proposed charter reform does not severely affect the current county supervisors. Since many of these county supervisors have been in office for so long, their salary and benefits are grandfathered in.

WHAT ARE THE COUNTY SUPERVISORS DOING THAT DOESN’T FOLLOW THE COUNTY CHARTER?

Cut their meeting requirements in half without voter approval


The San Bernardino County Charter states that the Board of Supervisors must attend a minimum of four meetings per month. Without voter approval, the Board of Supervisors cut their required number of meetings in half and now only meet twice a month, while making a larger base salary than the Vice President of the United States. How is it that a County Supervisor is making more than a California Congressmen and the California Governor? Making well over $200,000 with benefits and deferred compensation, the average cost per meeting for each supervisor is $10,603.


Hired a new County CEO without voter approval


In 2010/2011, the San Bernardino County Board of Supervisors hired CEO Gary Devereux. Today, County CEO Gary McBride oversees the Board of Supervisors while getting compensated over $550,000. This is just another way to show that the Board of Supervisors’ spending habits continue to be out-of-control. Their disdain for the limits the people has put on them continue to be ignored. Now they want you, the people of San Bernardino County to correct a charter they continually do not follow in the first place.

IN RELATION TO SURROUNDING CALIFORNIA COUNTIES? HOW DOES SBC COMPARE?

The Average Pay for Full-Time Year-Round County Employees in San Bernardino County is $128,899 while Riverside County and San Diego County’s average pay is $114,135 and $119,619, respectively. Meanwhile, Median Household Income continues to be lower than Southern California’s surrounding counties as shown below:

Orange County’s Median Household Income is 41% higher than San Bernardino County’s

Riverside County’s Median Household Income is 5% higher than San Bernardino County’s

Los Angeles County’s Median Household Income is 7% higher than San Bernardino County’s

San Diego County’s Median Household Income is 24% higher than San Bernardino County’s

San Bernardino County residents continue to feel the burden due to companies, revenue, and jobs consistently leaving the county.

WHY DO WE BELIEVE $60,000 IS FAIR COMPENSATION FOR A COUNTY SUPERVISOR?

The proposed $60,000 only applies to their baseline salary. County Supervisors would still be receiving additional compensation from the boards they sit on as well. The point is that $60,000 is appropriate compensation for the amount that they are currently working. $60,000 is also an important number as it is on par with the average household wage in San Bernardino County. If that is too little for the County Supervisors, they should focus on improving the livelihoods of San Bernardino County.

Additional County Data

HOW HAS UNEMPLOYMENT CHANGED IN SAN BERNARDINO COUNTY?

How does Unemployment in San Bernardino County compare with the state of California and the US? Pre-pandemic, unemployment rates in San Bernardino County were higher than both California and the US. From 2010-2019, San Bernardino County saw their highest unemployment rate at 13.50% while California’s highest was 12.2% and the United States was 9.60%. Today, Unemployment rates in San Bernardino County are still 3% higher than the United States.

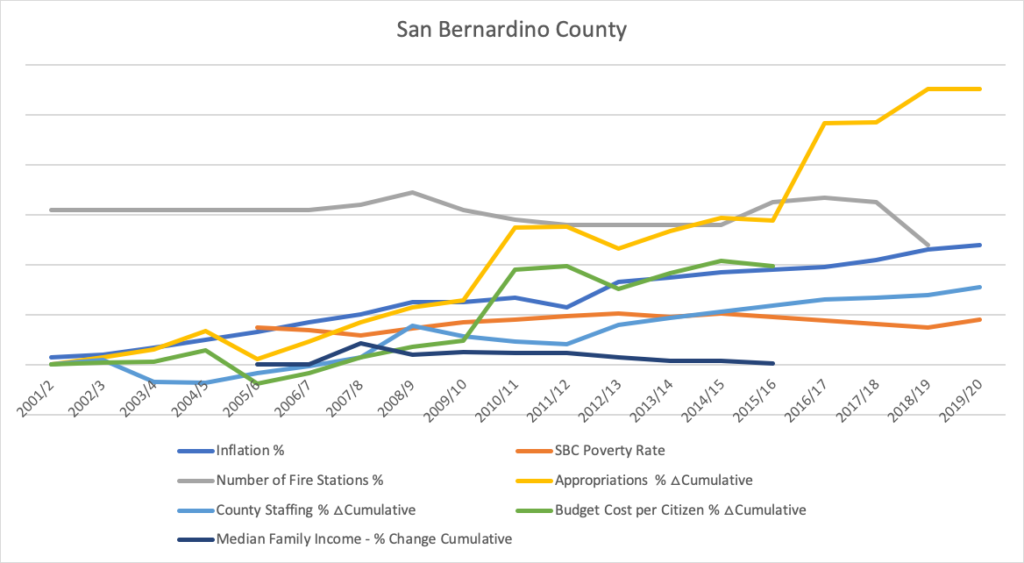
HOW HAS THE COUNTY BUDGET COST PER CITIZENS CHANGED IN RELATION TO MEDIAN FAMILY INCOME?

Year after year, the San Bernardino County budget continues to increase. Below is a graphic detailing how County Revenue (Yellow) and Budget Cost (Green) have increased per citizen yet the Median Family Income (Dark Blue) continues to decrease over time. With all the additional revenue the county is receiving, one would think the livelihoods of its citizens would improve as well.

SBC Cost Per Citizen to Median Family Income
HOW HAS HOMELESSNESS CHANGED IN SAN BERNARDINO COUNTY?

In the last year, homelessness in San Bernardino County has increased 19.9% while the unsheltered homeless population has increased by 24.5%. In January 2020, there were a total of 3,125 persons who were counted as homeless, which is 518 more people counted compared to the previous year or a 19.9% increase. (San Bernardino County Homelessness Partnership – Annual Point-In-Time Count).


What is the Supervisor’s Approach to Homelessness?


Fifth District Supervisor Josie Gonzales, who is also chairwoman of the Interagency Council on Homelessness continues to emphasize that homelessness is a “top priority countywide”. However, the data says otherwise.


Since 2013…

Redlands’ Homeless Population has increased 195%

Needles’ Homeless Population has increased 480%

Yucca Valley’s Homeless Population has increased 200%

Yucaipa’s Homeless Population has increased 33%

Highland’s Homeless Population has increased 188%

Twentynine Palm’s Homeless Population has increased 700%

Victorville’s Homeless Population has increased 14%

Rialto’s Homeless Population has increased 412%

Supervisor Gonzales emphasized in interviews that the results are evidence of an actual problem statewide and gives the county an opportunity to be innovative in its plans to provide the much-needed resources. With their ever-increasing budget, how come this has not changed?

HOW HAVE CRIME RATES CHANGED IN SAN BERNARDINO COUNTY?

From 2014-2018, violent crime rates overall in San Bernardino County increased 24%.

From 2014-2018:

Rapes increased 93%

Robberies increased 24%

Aggravated Assault increased 19%

Homicide increased 12%

During this same period, the Board of Supervisors budget has increased 30%, where is the money going to help solve the problems right here in our own county?

We are glad you are here and want to make a difference. Join our team!